How ChatGPT Helps with Terraform Code

How ChatGPT Helps with Terraform Code

How ChatGPT Helps with Terraform Code

Problem Statement

  1. Writing Terraform code can be time-consuming and challenging, especially for complex infrastructures
  2. Developers often face difficulties in defining resources, managing the state, and implementing reusability 

Proposed Solution

  • ChatGPT, powered by OpenAI’s GPT-3.5, is an AI language model that understands and generates human-like text.
  • By leveraging ChatGPT, you can interactively generate Terraform code with natural language inputs.

Implementation Steps

  • Define Infrastructure: Clearly describe the desired infrastructure components in natural language.
  • Generate Terraform Code: Utilize ChatGPT to produce Terraform code based on your descriptions.
  • Refine the Code: Iterate and fine-tune the generated code for accuracy and completeness.

First effectively interact with the AI model with our requirement.

Example:-

create terraform code with the below details.
– use the modules folder for resources so we can use the module approach.
– create two separate directories for dev and uat environments to manage to terraform code
– create ec2 instance with customized vpc, subnets, security group
– use the backend as s3

The possible solution structure proposed by AI

terraform/
├── dev/
│ ├── main.tf
│ ├── variables.tf
│ ├── outputs.tf
│ └── terraform.tfvars
├── uat/
│ ├── main.tf
│ ├── variables.tf
│ ├── outputs.tf
│ └── terraform.tfvars
└── modules/
├── ec2_instance/
│ ├── main.tf
│ ├── variables.tf
│ └── outputs.tf
└── vpc/
├── main.tf
├── variables.tf
└── outputs.tf


Challenges

  • Understanding Complex Requirements
  • Ambiguous or Incomplete Responses
  • Lack of Domain-Specific Knowledge
  • Security Concerns
  • Dependency on Model Availability
  • Limited Debugging Support
What Metrics Should You Monitor in Kubernetes

What Metrics Should You Monitor in Kubernetes

Challenging in selecting good metrics for monitoring:-

Choosing good metrics for Kubernetes monitoring can be challenging due to the need to determine relevant metrics for specific applications, manage the overwhelming volume of available data, understand complex interdependencies, lack of standardization, and balance scalability and performance impact.

The best Practices for Kubernetes Monitoring Metrics are:-

1. CPU Metrics:

– CPU Utilization: Measures the percentage of CPU capacity used by pods or containers.
– CPU Load: Monitors the average number of processes in the CPU’s run queue, indicating CPU congestion.
– CPU Usage: Tracks the CPU usage percentage by individual pods or containers.
– CPU Frequency: Measures the CPU clock speed, indicating the processing power available.
– CPU Throttling: Monitors the number of CPU throttling events, which occur when a container exceeds its CPU limit.

2. Memory Metrics:

– Memory Utilization: Measures the percentage of memory capacity used by pods or containers.
– Memory Load: Monitors the average number of processes waiting for memory, indicating memory congestion.
– Memory Usage: Tracks the memory usage percentage by individual pods or containers.
– Memory Pressure: Measures the memory pressure on nodes or containers, indicating potential resource constraints.
– Memory Capacity: Tracks the total memory capacity of nodes or containers.
– Memory Allocation: Monitors the allocated memory by individual pods or containers.

3. Network Metrics:

– Network Throughput: Measures the amount of data transmitted per unit of time, indicating network performance.
– Network Latency: Monitors the time taken for a packet to travel from source to destination, indicating network responsiveness.
– Network Packet Loss: Tracks the percentage of lost network packets, indicating network reliability.
– Network Congestion: Monitors network congestion levels, indicating potential network bottlenecks.
– Network Errors: Tracks the number of network errors or packet drops, indicating network stability.
– Network Bandwidth: Measures the available network bandwidth, indicating network capacity.

4. Storage Metrics:

– Storage Capacity: Tracks the storage capacity of persistent volumes, indicating available storage space.
– Storage Latency: Measures the time taken to read from or write to storage, indicating storage performance.
– Storage Read/Write Performance: Monitors the read and write performance of storage, indicating data transfer speeds.
– Storage Errors: Tracks the number of storage-related errors, indicating potential issues with storage systems.
– Storage Utilization: Measures the percentage of storage capacity used by persistent volumes.

5. Pod Metrics:

– Pod Creation Time: Measures the time taken to create pods, indicating deployment speed.
– Pod Execution Time: Tracks the time taken for pods to complete their execution, indicating performance efficiency.
– Pod Memory/CPU Usage: Monitors the memory and CPU usage of individual pods, indicating resource consumption.
– Pod Uptime: Tracks the duration for which pods have been running, indicating stability and reliability.
– Pod Restarts: Measures the number of times pods have been restarted, indicating potential issues.
– Pod Failures: Tracks the number of pod failures, indicating application reliability.

6. Deployment Metrics:

– Deployment Time: Measures the time taken to deploy applications, indicating deployment efficiency.
– Deployment Success Rate: Monitors the success rate of deployments, indicating application stability.
– Deployment Failure Rate: Tracks the failure rate of deployments, indicating potential issues.
– Deployment Rollbacks: Measures the number of deployment rollbacks, indicating potential deployment problems.
– Deployment Rollout Time: Monitors the time taken for deployments to roll out, indicating deployment speed.

7. Autoscaling Metrics:

– Autoscaling Events: Tracks the events triggering autoscaling actions, indicating workload changes.
– Autoscaling Thresholds: Monitors the threshold values for autoscaling, indicating when scaling should occur.
– Autoscaling Requests: Measures the number of autoscaling requests, indicating the frequency of scaling actions.
– Autoscaling Success Rate: Tracks the success rate of autoscaling actions, indicating the effectiveness of scaling.
– Autoscaling Failure Rate: Measures the failure rate of autoscaling actions, indicating potential issues with scaling algorithms.

New features in Kubernetes 1.27

New features in Kubernetes 1.27

  • Enhanced Container Resource-based Pod Autoscaling: You can use this feature to scale your pods based on the amount of CPU or memory resources they are using. For example, you can configure Kubernetes to scale your pods up when the CPU usage of your pods exceeds 80%, and scale them down when the CPU usage drops below 50%. Here is an example of a HorizontalPodAutoscaler (HPA) that you can use to do this:
apiVersion: autoscaling/v2beta1
kind: HorizontalPodAutoscaler
metadata:
  name: my-hpa
spec:
  scaleTargetRef:
    apiVersion: apps/v1
    kind: Deployment
    name: my-deployment
  minReplicas: 1
  maxReplicas: 10
  targetCPUUtilizationPercentage: 80
  • Enhanced Security Features: You can use the new security features in Kubernetes 1.27 to improve the security of your cluster. For example, you can configure Kubernetes to enable the RuntimeDefault seccomp profile for all of your pods. This will help to protect your pods from a variety of attacks, such as code injection attacks and denial-of-service attacks. Here is an example of a Pod Security Policy (PSP) that you can use to do this:
apiVersion: policy/v1beta1
kind: PodSecurityPolicy
metadata:
  name: my-psp
spec:
  allowedCapabilities:
  - SYS_ADMIN
  - NET_RAW
  seLinux:
    rule: RunAsAny
  • Enhancements in Container Runtime Interface (CRI)
    • Graduation of Containerd to Beta: You can use Containerd as a container runtime for Kubernetes 1.27. This is a popular container runtime that provides a simple and reliable way to run containers in production environments. Here is an example of how you can configure Kubernetes to use Containerd:
apiVersion: v1
kind: ConfigMap
metadata:
  name: containerd-config
data:
  config.toml: |
    [plugins]
      [plugins.cri]
        enabled = true
* **Support for Endpoint Slices:** You can use Endpoint Slices to represent endpoints of Services in Kubernetes 1.27. This is a more scalable and efficient way to represent endpoints of Services than the previous method, which used Endpoints. Here is an example of a Service that uses Endpoint Slices:
apiVersion: v1
kind: Service
metadata:
  name: my-service
spec:
  type: ClusterIP
  selector:
    app: my-app
  ports:
  - name: http
    port: 80
    targetPort: 80
  endpoints:
  - addresses:
    - ip: 10.10.10.10
    ports:
    - name: http
      port: 80
  - addresses:
    - ip: 10.10.10.11
    ports:
    - name: http
      port: 80
  • Other Features: Here are some other examples of how you can use the new features in Kubernetes 1.27:
    • You can use the VolumeGroupSnapshot feature to create a snapshot of your stateful application’s data. This will allow you to restore your data if your application experiences a failure.
    • You can use the Match Conditions for CEL in Admission Policy feature to create an admission control policy that only allows pods to be created if they meet certain criteria, such as having a certain label or being running on a certain node.
    • You can use the legacy k8s.gcr.io Container Image Registry Redirected to registry.k8s.io feature to access Kubernetes images from any cloud provider.
Kubernetes_Monitoring

Kubernetes_Monitoring

Kubernetes_Monitoring


Prerequisites must be installed and configured.

  • Kubernetes

All action done on kubernetes master server.

Clone or copy YAML script from below git repo.

git clone https://github.com/bibinwilson/kubernetes-prometheus

Create a monitoring Namespace

[root@kmaster ~]# kubectl create namespace monitoring

You need to assign cluster reader permission to this namespace so that Prometheus can fetch the metrics from kubernetes API’s.

[root@kmaster ~]# kubectl create -f clusterRole.yaml

Create a Config Map
We should create a config map with all the prometheus scrape config and alerting rules,
which will be mounted to the Prometheus container in /etc/prometheus as prometheus.yaml and prometheus.rules files.
The prometheus.yaml contains all the configuration to dynamically discover pods and services running in the kubernetes cluster.
prometheus.rules will contain all the alert rules for sending alerts to alert manager.

[root@kmaster ~]# kubectl create -f config-map.yaml -n monitoring

Create a Prometheus Deployment

[root@kmaster ~]# kubectl create  -f prometheus-deployment.yaml --namespace=monitoring
[root@kmaster ~]# kubectl get deployments --namespace=monitoring
NAME                    READY   UP-TO-DATE   AVAILABLE   AGE
prometheus-deployment   1/1     1            1           16m

Get the Prometheus pod name.

[root@kmaster ~]# kubectl get pods --namespace=monitoring
NAME                                    READY   STATUS    RESTARTS   AGE
prometheus-deployment-fd6676489-wmn6w   1/1     Running   0          18m

Exposing Prometheus as a Service so we can connect prometheus with Grafana.

To access the Prometheus dashboard over a IP or a DNS name, you need to expose it as kubernetes service.
Note: If you are on AWS or Google Cloud, You can use Loadbalancer type, which will create a load balancer and points it to the service.

[root@kmaster ~]# kubectl create -f prometheus-service.yaml --namespace=monitoring
[root@kmaster ~]# kubectl get services  --namespace=monitoring
NAME                 TYPE       CLUSTER-IP      EXTERNAL-IP   PORT(S)          AGE
prometheus-service   NodePort   10.103.247.50   <none>        8080:30000/TCP   24s

Once created, you can access the Prometheus dashboard using any Kubernetes node IP on port 30000. If you are on the cloud, make sure you have the right firewall rules for accessing the apps.

In my example "Grafana" deploy on separate server.

Add repo to install "Grafana"

[root@feenixdv yum.repos.d]# cat grafana.repo
[grafana]
name=grafana
baseurl=https://packages.grafana.com/oss/rpm
repo_gpgcheck=1
enabled=1
gpgcheck=1
gpgkey=https://packages.grafana.com/gpg.key
sslverify=1
sslcacert=/etc/pki/tls/certs/ca-bundle.crt

[root@feenixdv yum.repos.d]# yum install grafana
[root@feenixdv yum.repos.d]# yum list installed grafana
Loaded plugins: langpacks, product-id, search-disabled-repos, subscription-manager
This system is not registered to Red Hat Subscription Management. You can use subscription-manager to register.
Installed Packages
grafana.x86_64                                                    6.0.1-1                                                     @grafana
[root@feenixdv yum.repos.d]# systemctl restart grafana-server.service
[root@feenixdv yum.repos.d]# systemctl status grafana-server
? grafana-server.service - Grafana instance
   Loaded: loaded (/usr/lib/systemd/system/grafana-server.service; enabled; vendor preset: disabled)
   Active: active (running) since Thu 2019-03-14 20:54:34 PDT; 5h 35min ago

Now Grafana access on http://IP:3000. Default login is "admin/admin".
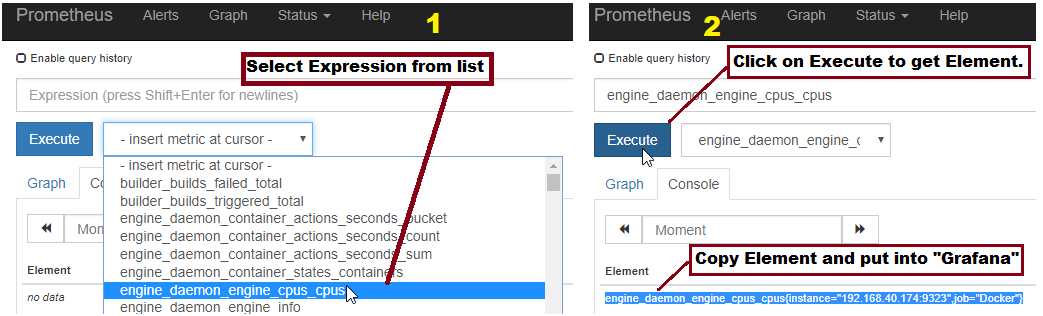
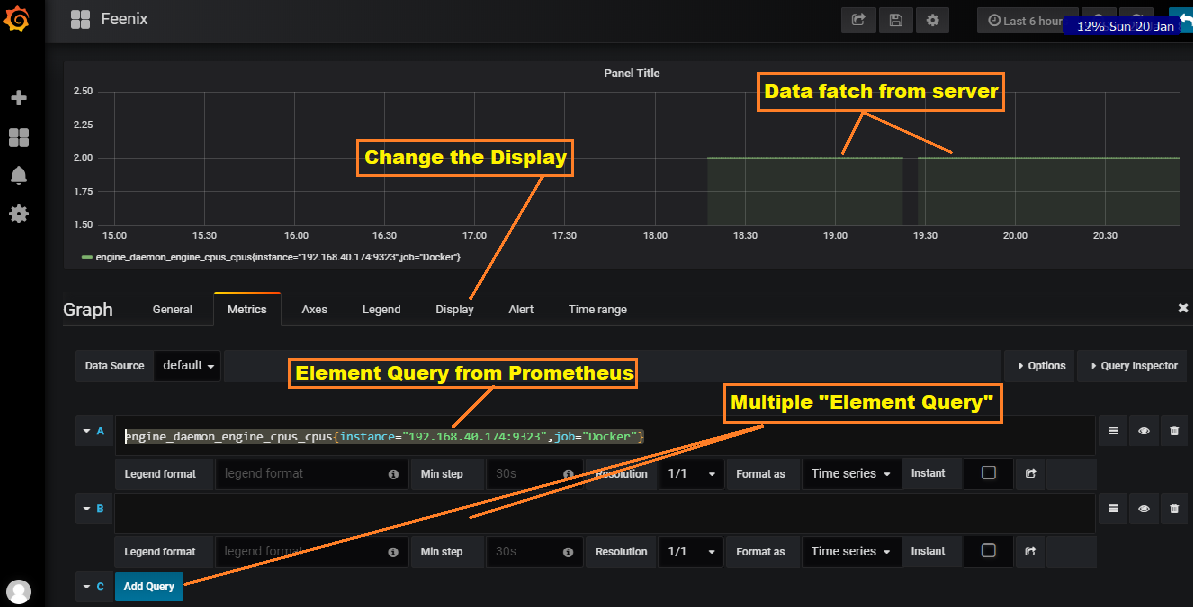
Now create connection with Prometheus and create graph.

Now craete graph.

Example:-

Variables:-

Name:- Node Query:- label_values(kubernetes_io_hostname)
Name:- Deployment Query:- label_values(deployment)
Name:- Statefulset Query:- label_values(statefulset)
Name:- Daemonset Query:- label_values(daemonset)
 
some Graph query example:-
Name:- 10 CPU hungry pods
Visualization:- Graph
Query:- sort_desc(topk(10, sum by (pod_name)( rate(container_cpu_usage_seconds_total{pod_name!=""}[1m] ) )))


Name:-10 memory hungry pods
Visualization:-Graph
Query:-sort_desc(topk(10, sum(container_memory_usage_bytes{pod_name!=""}) by (pod_name)))

Name:-Deployment CPU usage
Visualization:-Singlestat
Query:-sum (rate (container_cpu_usage_seconds_total{pod_name=~"^$Deployment$Statefulset$Daemonset.*$", kubernetes_io_hostname=~"^$Node$"}[2m])) / sum (machine_cpu_cores{kubernetes_io_hostname=~"^$Node$"}) * 100

Name:-CPU usage
Visualization:-Graph
Query:-sum (rate (container_cpu_usage_seconds_total{image!="",name=~"^k8s_.*",io_kubernetes_container_name!="POD",pod_name=~"^$Deployment$Statefulset$Daemonset.*$",kubernetes_io_hostname=~"^$Node$"}[1m])) by (pod_name,kubernetes_io_hostname)
sum (kube_pod_container_resource_requests_cpu_cores{pod=~"^$Deployment$Statefulset$Daemonset.*$",node=~"^$Node$"}) by (pod,node)
sum ((kube_node_status_allocatable_cpu_cores{node=~"^$Node$"})) by (node)

Name:-Memory usage
Visualization:-Graph
Query:-sum (container_memory_working_set_bytes{id!="/",pod_name=~"^$Deployment$Statefulset$Daemonset.*$",kubernetes_io_hostname=~"^$Node$"}) by (pod_name,kubernetes_io_hostname)
sum ((kube_pod_container_resource_requests_memory_bytes{pod=~"^$Deployment$Statefulset$Daemonset.*$",node=~"^$Node$"})) by (pod,node)
sum ((kube_node_status_allocatable_memory_bytes{node=~"^$Node$"})) by (node)

Name:-All processes network I/O
Visualization:-Graph
Query:-sum (rate (container_network_receive_bytes_total{id!="/",pod_name=~"^$Deployment$Statefulset$Daemonset.*$",kubernetes_io_hostname=~"^$Node$"}[1m])) by (pod_name, kubernetes_io_hostname)
– sum( rate (container_network_transmit_bytes_total{id!="/",pod_name=~"^$Deployment$Statefulset$Daemonset.*$",kubernetes_io_hostname=~"^$Node$"}[1m])) by (pod_name, kubernetes_io_hostname)

Kubernetes_Dashboard

Kubernetes_Dashboard

Kubernetes_Dashboard_Setup


After "kubernetes-on-VMware-workstation-or-VirtualBox" install web UI to access Kubernetes_Dashboard

Install dashboard on Master only

[root@kmaster ~]# kubectl apply -f https://raw.githubusercontent.com/kubernetes/dashboard/v1.10.1/src/deploy/recommended/kubernetes-dashboard.yaml
secret/kubernetes-dashboard-certs created
serviceaccount/kubernetes-dashboard created
role.rbac.authorization.k8s.io/kubernetes-dashboard-minimal created
rolebinding.rbac.authorization.k8s.io/kubernetes-dashboard-minimal created
deployment.apps/kubernetes-dashboard created
service/kubernetes-dashboard created

Check "kubernetes-dashboard" is running or not

[root@kmaster ~]# kubectl get pod -o wide --all-namespaces
kube-system   kubernetes-dashboard-57df4db6b-5zm4k   1/1     Running       0          92s   10.244.0.13      kmaster   <none>           <none>

Add Admin-role

[root@kmaster ~]# kubectl apply -f https://gist.githubusercontent.com/chukaofili/9e94d966e73566eba5abdca7ccb067e6/raw/0f17cd37d2932fb4c3a2e7f4434d08bc64432090/k8s-dashboard-admin-user.yaml
serviceaccount/admin-user created
clusterrolebinding.rbac.authorization.k8s.io/admin-user created
[root@kmaster ~]# kubectl get sa admin-user -n kube-system
NAME         SECRETS   AGE
admin-user   1         11s

Get admin-user-token

[root@kmaster ~]# kubectl describe sa admin-user -n kube-system
Name:                admin-user
Namespace:           kube-system
Labels:              <none>
Annotations:         kubectl.kubernetes.io/last-applied-configuration:
                       {"apiVersion":"v1","kind":"ServiceAccount","metadata":{"annotations":{},"name":"admin-user","namespace":"kube-system"}}
Image pull secrets:  <none>
Mountable secrets:   admin-user-token-gt42f
Tokens:              admin-user-token-gt42f
Events:              <none>
[root@kmaster ~]# kubectl describe secret admin-user-token-gt42f -n kube-system
Name:         admin-user-token-gt42f
Namespace:    kube-system
Labels:       <none>
Annotations:  kubernetes.io/service-account.name: admin-user
              kubernetes.io/service-account.uid: 7ba5f30a-2c69-11e9-9e6d-000c29a96cf0

Type:  kubernetes.io/service-account-token

Data
====
ca.crt:     1025 bytes
namespace:  11 bytes
token:      eyJhbGciOiJSUzI1NiIsImtpZCI6IiJ9.eyJpc3MiOiJrdWJlcm5ldGVzL3NlcnZpY2VhY2NvdW50Iiwia3ViZXJuZXRlcy5pby9zZXJ2aWNlYWNjb3VudC9uYW1lc3BhY2UiOiJrdWJlLXN5c3RlbSIsImt1YmVybmV0ZXMuaW8vc2VydmljZWFjY291bnQvc2VjcmV0Lm5hbWUiOiJhZG1pbi11c2VyLXRva2VuLWd0NDJmIiwia3ViZXJuZXRlcy5pby9zZXJ2aWNlYWNjb3VudC9zZXJ2aWNlLWFjY291bnQubmFtZSI6ImFkbWluLXVzZXIiLCJrdWJlcm5ldGVzLmlvL3NlcnZpY2VhY2NvdW50L3NlcnZpY2UtYWNjb3VudC51aWQiOiI3YmE1ZjMwYS0yYzY5LTExZTktOWU2ZC0wMDBjMjlhOTZjZjAiLCJzdWIiOiJzeXN0ZW06c2VydmljZWFjY291bnQ6a3ViZS1zeXN0ZW06YWRtaW4tdXNlciJ9.Z2AKuy4q2X9GaqnsotH5PdXLF7I55qv5XWKmPmAbVqzPYzpWAQpr603YNiHsYMoVriQl5X_0m6wxCK7AFB3xTZfBXECtvmmxJQ17wRZIRbnVV-FRsYHBMdn6CEwSb-u1uf4upNpeBnr0gC1vCq4Rwj4jMBc6Gr-4VJfrgXWMCQirwvfxgUhTun3Bv_vNDAn4Wu93ga1cnBfgZXJg9FTsKkJM9R9SHN4oz7q6FfvujGkhxysz14HLXW6Z5ezN1TO8JVYpURtJ60lWdtWLfi2KCRVIoGcJ-VvOfNs_lrGt2dIReDOBUHrC4DGcThy3Ce8ZJ_QMp_8-3HHAZ-obii9AtA

Use this token to access kubernetes dashboard. Before that you need to start kubectl proxy.

[root@kmaster ~]# kubectl proxy
Starting to serve on 127.0.0.1:8001

To access "kubernetes dashboard" on our local browser we need to set tunnel in putty.

Now we can access "kubernetes dashboard" on the local browser using token ID.


kubernetes On “VMware Workstation” or “vitrualBox”

kubernetes On “VMware Workstation” or “vitrualBox”

kubernetes deployment on "VMware Workstation Pro" or "VirtualBox"


In my lab setup:-

192.168.40.191 kmaster RHEL7.3 CPU_CORE:- 2
192.168.40.192 knode1 RHEL7.3 CPU_CORE:- 1
192.168.40.193 knode2 RHEL7.3 CPU_CORE:- 1


On both (Master and Node)
—————————–
In this example, I am going to disable SELinux on master and node both.

#sed -i -e s/enforcing/disabled/g /etc/sysconfig/selinux;
#sed -i -e s/permissive/disabled/g /etc/sysconfig/selinux
#setenforce 0
#sed -i --follow-symlinks 's/SELINUX=enforcing/SELINUX=disabled/g' /etc/sysconfig/selinux

Also, disable the firewall.

#systemctl disable firewalld
#systemctl stop firewalld

Enable network bridge.

#modprobe br_netfilter
#echo '1' > /proc/sys/net/bridge/bridge-nf-call-iptables

Make swap off for installation.

#swapoff -a && sed -i '/swap/d' /etc/fstab

Install requisitory(Docker)

#yum install -y yum-utils device-mapper-persistent-data lvm2
#yum-config-manager --add-repo https://download.docker.com/linux/centos/docker-ce.repo
#yum install -y docker-ce

Add kubernetes repo to install kubernetes

#cat <<EOF > /etc/yum.repos.d/kubernetes.repo
[kubernetes]
name=Kubernetes
baseurl=https://packages.cloud.google.com/yum/repos/kubernetes-el7-x86_64
enabled=1
gpgcheck=1
repo_gpgcheck=1
gpgkey=https://packages.cloud.google.com/yum/doc/yum-key.gpg
        https://packages.cloud.google.com/yum/doc/rpm-package-key.gpg
EOF

#yum install -y kubelet kubeadm kubectl

#systemctl start docker && systemctl enable docker
#systemctl start kubelet && systemctl enable kubelet
#sed -i 's/cgroup-driver=systemd/cgroup-driver=cgroupfs/g' /etc/systemd/system/kubelet.service.d/10-kubeadm.conf
#systemctl daemon-reload

On master only
——————-
Add network bridge configuration in a file and reload values.

[root@kmaster ~]# cat <<EOF >  /etc/sysctl.d/k8s.conf
net.bridge.bridge-nf-call-ip6tables = 1
net.bridge.bridge-nf-call-iptables = 1
EOF
[root@kmaster ~]# sysctl --system

Put "admin.conf" in ".bash_profile" to load at login time.

[root@kmaster ~]# echo 'export KUBECONFIG=/etc/kubernetes/admin.conf' >> ~/.bash_profile
[root@kmaster ~]# source ~/.bash_profile

Note:- If you are using any type of proxy on any node, disable before kubernetes initialization.

[root@kmaster ~]# unset http_proxy
[root@kmaster ~]# unset https_proxy

Now launch the initialization script.

[root@kmaster ~]# kubeadm init --ignore-preflight-errors all --pod-network-cidr=10.244.0.0/16 --token-ttl 0
I0209 04:38:11.240261    4481 version.go:94] could not fetch a Kubernetes version from the internet: unable to get URL "https://dl.k8s.io/release/stable-1.txt": Get https://storage.googleapis.com/kubernetes-release/release/stable-1.txt: net/http: request canceled while waiting for connection (Client.Timeout exceeded while awaiting headers)
I0209 04:38:11.240748    4481 version.go:95] falling back to the local client version: v1.13.3
[init] Using Kubernetes version: v1.13.3
[preflight] Running pre-flight checks

[WARNING SystemVerification]: this Docker version is not on the list of validated versions: 18.09.0. Latest validated version: 18.06
[preflight] Pulling images required for setting up a Kubernetes cluster
[preflight] This might take a minute or two, depending on the speed of your internet connection
[preflight] You can also perform this action in beforehand using 'kubeadm config images pull'
[kubelet-start] Writing kubelet environment file with flags to file "/var/lib/kubelet/kubeadm-flags.env"
[kubelet-start] Writing kubelet configuration to file "/var/lib/kubelet/config.yaml"

.

.

.

[addons] Applied essential addon: CoreDNS
[addons] Applied essential addon: kube-proxy

Your Kubernetes master has initialized successfully!

To start using your cluster, you need to run the following as a regular user:

  mkdir -p $HOME/.kube
  sudo cp -i /etc/kubernetes/admin.conf $HOME/.kube/config
  sudo chown $(id -u):$(id -g) $HOME/.kube/config

You should now deploy a pod network to the cluster.
Run "kubectl apply -f [podnetwork].yaml" with one of the options listed at:
  https://kubernetes.io/docs/concepts/cluster-administration/addons/

You can now join any number of machines by running the following on each node
as root:

  kubeadm join 192.168.40.184:6443 --token yz06cb.3mtnv1swalusctr1 --discovery-token-ca-cert-hash sha256:ea180f65eb0b8b3e6d0122300fa02d49592d08283c8f9f5091787ff080692c93


Run below command as suggested in the last installation screen.

[root@kmaster ~]# mkdir -p $HOME/.kube
[root@kmaster ~]# sudo cp -i /etc/kubernetes/admin.conf $HOME/.kube/config
[root@kmaster ~]# sudo chown $(id -u):$(id -g) $HOME/.kube/config

Check name-spaces

[root@kmaster ~]# kubectl get pods --all-namespaces
NAMESPACE     NAME                            READY   STATUS    RESTARTS   AGE
kube-system   coredns-86c58d9df4-2ftxf        0/1     Pending   0          2m52s
kube-system   coredns-86c58d9df4-plxft        0/1     Pending   0          2m52s
kube-system   etcd-kmaster                      1/1     Running   0          2m20s
kube-system   kube-apiserver-kmaster            1/1     Running   0          2m13s
kube-system   kube-controller-manager-kmaster   1/1     Running   0          2m19s
kube-system   kube-proxy-fpr6w                1/1     Running   0          2m52s
kube-system   kube-scheduler-kmaster            1/1     Running   0          2m8s

Install POD network (only one pod network per cluster) to change "coredns" pending to running state.

[root@kmaster ~]# kubectl apply -f https://raw.githubusercontent.com/coreos/flannel/bc79dd1505b0c8681ece4de4c0d86c5cd2643275/Documentation/kube-flannel.yml
clusterrole.rbac.authorization.k8s.io/flannel created
clusterrolebinding.rbac.authorization.k8s.io/flannel created
serviceaccount/flannel created
configmap/kube-flannel-cfg created
daemonset.extensions/kube-flannel-ds-amd64 created
daemonset.extensions/kube-flannel-ds-arm64 created
daemonset.extensions/kube-flannel-ds-arm created
daemonset.extensions/kube-flannel-ds-ppc64le created
daemonset.extensions/kube-flannel-ds-s390x created

Now all are in running state.

[root@kmaster ~]# kubectl get pods --all-namespaces
NAMESPACE     NAME                            READY   STATUS    RESTARTS   AGE
kube-system   coredns-86c58d9df4-2ftxf        1/1     Running   0          7m2s
kube-system   coredns-86c58d9df4-plxft        1/1     Running   0          7m2s
kube-system   etcd-kmaster                      1/1     Running   0          6m30s
kube-system   kube-apiserver-kmaster            1/1     Running   0          6m23s
kube-system   kube-controller-manager-kmaster   1/1     Running   0          6m29s
kube-system   kube-flannel-ds-amd64-v59nj     1/1     Running   0          3m2s
kube-system   kube-proxy-fpr6w                1/1     Running   0          7m2s
kube-system   kube-scheduler-kmaster            1/1     Running   0          6m18s


To join any node with master cluster

[root@knode1 ~]# kubeadm join 192.168.40.184:6443 --token gfjzba.ci5gvqt09lqpspzm --discovery-token-ca-cert-hash sha256:0dfb374c6cc87683c0ff5e8e04e149738934c25ab2bcfb1ca72f501847f06301

To check available joined node on master

[root@kmaster ~]# kubectl get nodes
NAME      STATUS   ROLES    AGE   VERSION
kmaster   Ready    master   26h   v1.13.3
knode1    Ready    <none>   26h   v1.13.3
knode2    Ready    <none>   26h   v1.13.3
Grafana_Blackbox_Exporter

Grafana_Blackbox_Exporter

blackbox_exporter


The blackbox exporter allows blackbox probing of endpoints over HTTP, HTTPS, DNS, TCP, and ICMP. Data use by “Prometheus” and using these data we can create graph into Grafana.


Download blackbox_exporter and extract it.

[root@feenixdv ~]# wget https://github.com/prometheus/blackbox_exporter/releases/download/v0.13.0/blackbox_exporter-0.13.0.linux-amd64.tar.gz
[root@feenixdv ~]# tar zxvf blackbox_exporter-0.13.0.linux-amd64.tar.gz
blackbox_exporter-0.13.0.linux-amd64/
blackbox_exporter-0.13.0.linux-amd64/LICENSE
blackbox_exporter-0.13.0.linux-amd64/blackbox.yml
blackbox_exporter-0.13.0.linux-amd64/NOTICE
blackbox_exporter-0.13.0.linux-amd64/blackbox_exporter
[root@feenixdv ~]# cd blackbox_exporter-0.13.0.linux-amd64/


Now update ” blackbox.yml”.

Here I am going to put URL monitoring through blackbox.

[root@feenixdv blackbox_exporter-0.13.0.linux-amd64]# cat blackbox.yml

.
.
url_check:
    prober: http
    # timeout: 5s
    http:
      valid_http_versions: ["HTTP/1.1", "HTTP/2"]
      valid_status_codes: []
      method: GET
      no_follow_redirects: false
      tls_config:
        insecure_skip_verify: false
      preferred_ip_protocol: "ipv4"
      fail_if_matches_regexp:
        - "Could not connect to database"

Where “url_check” is module name which is used in Prometheus (Prometheus.yml).

Now launch blackbox_exporter with customizing YML file.

[root@feenixdv blackbox_exporter-0.13.0.linux-amd64]# ./blackbox_exporter --config.file="blackbox.yml" &
level=info ts=2019-01-24T04:44:50.914686848Z caller=main.go:215 msg="Starting blackbox_exporter" version="(version=0.13.0, branch=HEAD, revision=1cfb7512daa7e100abb32037996c8f805990d813)"
level=info ts=2019-01-24T04:44:50.915308706Z caller=main.go:228 msg="Loaded config file"
level=info ts=2019-01-24T04:44:50.915427103Z caller=main.go:332 msg="Listening on address" address=:9115

By default its start on “9115” port.

Blackbox is running or not, we can check using below URL.

http://192.168.40.177:9115/probe?module=url_check&target=http://www.localhost

Now update “prometheus.yml” to check URL.

.
.
- job_name: "Blackbox URL check"
    metrics_path: /probe
    params:
      module: [url_check]
    static_configs:
      - targets:
          - http://google.com
          - https://feenixdv.com
          - http://bibhuti_narayan.com
    relabel_configs:
      - source_labels: [__address__]
        target_label: __param_target
      - source_labels: [__param_target]
        target_label: instance
      - target_label: __address__
        replacement: 192.168.40.177:9115

Now check Prometheus GUI.

Here we can see URL monitoring working fine.

Prometheus-Grafana-Node_Exporter

Prometheus-Grafana-Node_Exporter

Prometheus-Grafana-Node_Exporter

To start with on Infra monitoring front – we are going to have below tools

Node Exporter: This is kind of plugin which needs to be installed on the machine where host monitoring needs to be done [ For technology monitoring, there are separate plugins which needs to be installed as well e.g. KAFKA, Mongo etc. ]
 
Prometheus DB: Prometheus DB will be configured to listen to data generated by Node Exporter based on configured frequency and store them. Prometheus also come with UI where you can explore data and run queries on top of them.
 
Grafana UI:  Because UI given by Prometheus is not good and configurable for different kind of dashboard – we are going to use ready UI where we can plugin Prometheus as data source and configure graphs on required data.


How these tools are collaborated to each other.


Here I am going to setup infra using Docker.

Download Docker images for “Prometheus” and  “grafana”

[root@feenixdv ~]# docker pull grafana/grafana
[root@feenixdv ~]# docker pull prom/prometheus
[root@feenixdv ~]# docker images
REPOSITORY                           TAG                 IMAGE ID            CREATED             SIZE
prom/prometheus                      latest              5517f7057e72        4 days ago          97.8MB
grafana/grafana                      latest              d0454da13c84        6 days ago          240MB
The main configuration file of “Prometheus” is “prometheus.yml” which is located under container in “/etc/prometheus/prometheus.yml” location. In this example, its mapped on the local volume “/opt/prometheus/prometheus.yml”.
Create local volume structure and file look like.


[root@feenixdv ~]# mkdir –p /opt/prometheus/
[root@feenixdv ~]# cat /opt/prometheus/prometheus.yml
# my global config
global:
  scrape_interval:     15s # Set the scrape interval to every 15 seconds. Default is every 1 minute.
  evaluation_interval: 15s # Evaluate rules every 15 seconds. The default is every 1 minute.
  # scrape_timeout is set to the global default (10s).
# Alertmanager configuration
alerting:
  alertmanagers:
  - static_configs:
    - targets:
      # - alertmanager:9093

# Load rules once and periodically evaluate them according to the global 'evaluation_interval'.
rule_files:
  # - "first_rules.yml"
  # - "second_rules.yml"
# A scrape configuration containing exactly one endpoint to scrape:
# Here it's Prometheus itself.
scrape_configs:
  # The job name is added as a label `job=<job_name>` to any timeseries scraped from this config.
  - job_name: 'prometheus'
    # metrics_path defaults to '/metrics'
    # scheme defaults to 'http'.
    static_configs:
    - targets: ['localhost:9090']
  - job_name: 'PromNet'
    static_configs:
      - targets: ['192.168.40.173:9100']
  - job_name: 'Docker'
    static_configs:
      - targets: ['192.168.40.174:9323']


Configure “Node Exporter”.

In my example “Node Exporter” configured on separate VM.

            IP:- 192.168.40.173

Download “Node Exporter” and start it. By default its used “9100” port.

[root@localhost ~]# wget  https://github.com/prometheus/node_exporter/releases/download/v0.17.0/node_exporter-0.17.0.linux- amd64.tar.gz
[root@localhost ~]# tar zxvf node_exporter-0.17.0.linux-amd64.tar.gz
[root@localhost ~]# cd node_exporter-0.17.0.linux-amd64/
[root@localhost node_exporter-0.17.0.linux-amd64]# ./node_exporter &
[1] 3000
[root@localhost node_exporter-0.17.0.linux-amd64]# INFO[0000] Starting node_exporter (version=0.17.0, branch=HEAD, revision=f6f6194a436b9a63d0439abc585c76b19a206b21)  source="node_exporter.go:82"

INFO[0000] Build context (go=go1.11.2, user=root@322511e06ced, date=20181130-15:51:33)  source="node_exporter.go:83"

INFO[0000] Enabled collectors:                           source="node_exporter.go:90"

INFO[0000]  - arp                                        source="node_exporter.go:97"

INFO[0000]  - bcache                                     source="node_exporter.go:97"

INFO[0000]  - bonding                                    source="node_exporter.go:97"

INFO[0000]  - conntrack                                  source="node_exporter.go:97"

INFO[0000]  - cpu                                        source="node_exporter.go:97"

INFO[0000]  - diskstats                                  source="node_exporter.go:97"

INFO[0000]  - edac                                       source="node_exporter.go:97"

INFO[0000]  - entropy                                    source="node_exporter.go:97"

INFO[0000]  - filefd                                     source="node_exporter.go:97"

INFO[0000]  - filesystem                                 source="node_exporter.go:97"

INFO[0000]  - hwmon                                      source="node_exporter.go:97"

INFO[0000]  - infiniband                                 source="node_exporter.go:97"

INFO[0000]  - ipvs                                       source="node_exporter.go:97"

INFO[0000]  - loadavg                                    source="node_exporter.go:97"

INFO[0000]  - mdadm                                      source="node_exporter.go:97"

INFO[0000]  - meminfo                                    source="node_exporter.go:97"

INFO[0000]  - netclass                                   source="node_exporter.go:97"

INFO[0000]  - netdev                                     source="node_exporter.go:97"

INFO[0000]  - netstat                                    source="node_exporter.go:97"

INFO[0000]  - nfs                                        source="node_exporter.go:97"

INFO[0000]  - nfsd                                       source="node_exporter.go:97"

INFO[0000]  - sockstat                                   source="node_exporter.go:97"

INFO[0000]  - stat                                       source="node_exporter.go:97"

INFO[0000]  - textfile                                   source="node_exporter.go:97"

INFO[0000]  - time                                       source="node_exporter.go:97"

INFO[0000]  - timex                                      source="node_exporter.go:97"

INFO[0000]  - uname                                      source="node_exporter.go:97"

INFO[0000]  - vmstat                                     source="node_exporter.go:97"

INFO[0000]  - xfs                                        source="node_exporter.go:97"

INFO[0000]  - zfs                                        source="node_exporter.go:97"

INFO[0000] Listening on :9100                            source="node_exporter.go:111"

Check “Node Exporter” working on port “9100”.

Now start both container.

Prometheus:-
            IP:- 192.168.40.174
            PORT:- 9090
Grafana:-
            IP:- 192.168.40.174
            PORT:- 3000
[root@feenixdv ~]# docker run -itd --name prometheus1 -v /opt/prometheus/prometheus.yml:/etc/prometheus/prometheus.yml -p 9090:9090  prom/Prometheus
[root@feenixdv ~]# docker run -itd --name grafana -p 3000:3000 grafana/grafana

Check container up or not.

[root@feenixdv ~]# docker ps –a
11e1168e0deb        grafana/grafana        "/run.sh"                3 hours ago         Up 3 hours                   0.0.0.0:3000->3000/tcp   grafana
e747177e9db4        prom/prometheus        "/bin/prometheus"        4 hours ago         Up 2 hours                   0.0.0.0:9090->9090/tcp   prometheus1

Now check “Prometheus” accessible on browser or not.

URL:- http://192.168.40.174:9090

Also check targets part. In the configuration we have same output which was configured inside” Prometheus.yml”

Now check “Grafana”

URL:- http://192.168.40.174:3000

Default login and password is “admin”.


First we need to configure data-sources.

Because our data source are Prometheus so select Prometheus as data source.  

Fill details of Prometheus to connect and fetch data.

Once data source configured after that create graph. To create graph follow below screenshots.

Pick the query from Prometheus and put into Grafana


Add query string in Grafana.

Dashboard  look like this.


For Docker monitoring

for Docker monitoring we need to enable “metrices”. For enable create one file inside “/etc/docker”.

[root@feenixdv ~]# cat /etc/docker/daemon.json
{

                  "metrics-addr" : "192.168.40.174:9323",

                    "experimental" : true
}

Restart docker service and daemon.

[root@feenixdv ~]# systemctl daemon-reload
[root@feenixdv ~]# systemctl restart docker.service

Now Docker metrics are accessible on below URL.

http://192.168.40.174:9323/metrics

To monitor put required query string on “Grafana”.

Docker_Static_IP_To_Container

Docker_Static_IP_To_Container

Docker_Static_IP_To_Container

Why static IP to the container?

Each time when we restart container, IP address changed. Infect if we restart container in different sequences, its changed so to resolve this confliction we set static IP to the container.

For the testing here i am going to create two containers with the name of …

  1. test11
  2. test12

Creating a container with "centos" image and pass below parameter.

[root@feenixdv conf]# docker run -itd --privileged --name test11 -p 81:80 centos
1ea63b664f6f12c564fe72d9378a1b3bd1fad1115c897e69959394fca53836ce
[root@feenixdv conf]# docker run -itd --privileged --name test12 -p 82:80 centos
77cd950fcae3b204e26938453cb718eea8840cca5be96979bf99b2a3fdfdd811
[root@feenixdv conf]# docker ps -a
CONTAINER ID        IMAGE               COMMAND                  CREATED             STATUS              PORTS                    NAMES
77cd950fcae3        centos              "/bin/bash"              14 seconds ago      Up 14 seconds       0.0.0.0:82->80/tcp       test12
1ea63b664f6f        centos              "/bin/bash"              27 seconds ago      Up 24 seconds       0.0.0.0:81->80/tcp       test11

Now check the IP address of both containers.

[root@feenixdv conf]# docker inspect test11 |grep IPAddress
            "SecondaryIPAddresses": null,
            "IPAddress": "172.17.0.3",
                    "IPAddress": "172.17.0.3",
[root@feenixdv conf]# docker inspect test12 |grep IPAddress
            "SecondaryIPAddresses": null,
            "IPAddress": "172.17.0.4",
                    "IPAddress": "172.17.0.4",

Now going to stop and start the container. But I am not starting the container in the same sequence. First start "test12" then "test11".

                    
[root@feenixdv conf]# docker stop test11 test12
test11
test12
[root@feenixdv conf]# docker start test12 test11
test12
test11
[root@feenixdv conf]# docker inspect test11 |grep IPAddress
            "SecondaryIPAddresses": null,
            "IPAddress": "172.17.0.4",
                    "IPAddress": "172.17.0.4",
[root@feenixdv conf]# docker inspect test12 |grep IPAddress
            "SecondaryIPAddresses": null,
            "IPAddress": "172.17.0.3",
                    "IPAddress": "172.17.0.3",

 Here we can see IP sequence changes. test11 IP shifted into test12.

To resolve this, I am going to create my own bridge network with the name of "feenix_network", with below information.

               
[root@feenixdv conf]# docker network create --driver bridge --subnet 172.19.0.0/16 --gateway 172.19.0.1 feenix_network
2eff5c11b84832f422d2f0ea2996496ceb5396ae5cf8a67d129d061e4efa6c8a
[root@feenixdv conf]# docker network ls
NETWORK ID          NAME                DRIVER              SCOPE
38b84019872b        bridge              bridge              local
2eff5c11b848        feenix_network      bridge              local
c1c37ffd2bc3        host                host                local
855f2c69ad58        none                null                local

Now assign IP to both container.

[root@feenixdv conf]# docker network connect --ip 172.19.0.2 feenix_network test11
[root@feenixdv conf]# docker network connect --ip 172.19.0.3 feenix_network test12
[root@feenixdv conf]# docker inspect test11 |grep IPAddress
            "SecondaryIPAddresses": null,
            "IPAddress": "172.17.0.4",
                    "IPAddress": "172.17.0.4",
                    "IPAddress": "172.19.0.2",

Here we can see, two IP address assign to test11 and test12.

Release old IP with below command.

[root@feenixdv conf]# docker network disconnect bridge test11
[root@feenixdv conf]# docker network disconnect bridge test12
[root@feenixdv conf]# docker inspect test11 |grep IPAddress
            "SecondaryIPAddresses": null,
            "IPAddress": "",
                    "IPAddress": "172.19.0.2",
[root@feenixdv conf]# docker inspect test12 |grep IPAddress
            "SecondaryIPAddresses": null,
            "IPAddress": "",
                    "IPAddress": "172.19.0.3",

Here we can see everything is ok. All container have new IP.

Now going to test with restart container in different sequences.

[root@feenixdv conf]# docker stop test11 test12
test11
test12
[root@feenixdv conf]# docker start test12 test11
test12
test11
[root@feenixdv conf]# docker inspect test11 |grep IPAddress
            "SecondaryIPAddresses": null,
            "IPAddress": "",
                    "IPAddress": "172.19.0.2",
[root@feenixdv conf]# docker inspect test12 |grep IPAddress
            "SecondaryIPAddresses": null,
            "IPAddress": "",
                    "IPAddress": "172.19.0.3",

                    
         Done.   

Docker_Jenkins_Installation_Inside_Container

Docker_Jenkins_Installation_Inside_Container

Docker_Jenkins_Installation_InSide_Container

Inside the container, first, install perquestery ( JAVA )

[root@a5f159e16af7 /]# yum install java-1.8.0-openjdk-devel

Download Jenkins repo for YUM.

[root@a5f159e16af7 /]# curl --silent --location http://pkg.jenkins-ci.org/redhat-stable/jenkins.repo | tee /etc/yum.repos.d/jenkins.repo
[jenkins]
name=Jenkins-stable
baseurl=http://pkg.jenkins.io/redhat-stable
gpgcheck=1
[root@a5f159e16af7 /]# cat /etc/yum.repos.d/jenkins.repo
[jenkins]
name=Jenkins-stable
baseurl=http://pkg.jenkins.io/redhat-stable
gpgcheck=1

Import key (gpg key) for installation.

[root@a5f159e16af7 /]# rpm --import https://jenkins-ci.org/redhat/jenkins-ci.org.key

Install Jenkins using YUM.

[root@a5f159e16af7 /]# yum install jenkins
Loaded plugins: fastestmirror, ovl
Loading mirror speeds from cached hostfile
 * base: mirror.nbrc.ac.in
 * extras: mirror.nbrc.ac.in
 * updates: mirror.nbrc.ac.in
jenkins                                                                                                                                                              | 2.9 kB  00:00:00
jenkins/primary_db                                                                                                                                                   |  26 kB  00:00:00
Resolving Dependencies
--> Running transaction check
---> Package jenkins.noarch 0:2.150.1-1.1 will be installed
--> Finished Dependency Resolution

Dependencies Resolved

============================================================================================================================================================================================
 Package                                     Arch                                       Version                                           Repository                                   Size
============================================================================================================================================================================================
Installing:
 jenkins                                     noarch                                     2.150.1-1.1                                       jenkins                                      72 M

Transaction Summary
============================================================================================================================================================================================
Install  1 Package

Total download size: 72 M
Installed size: 72 M
Is this ok [y/d/N]: y
Downloading packages:
jenkins-2.150.1-1.1.noarch.rpm                                                                                                                                       |  72 MB  00:00:41
Running transaction check
Running transaction test
Transaction test succeeded
Running transaction
  Installing : jenkins-2.150.1-1.1.noarch                                                                                                                                               1/1
  Verifying  : jenkins-2.150.1-1.1.noarch                                                                                                                                               1/1

Installed:
  jenkins.noarch 0:2.150.1-1.1

Complete!

Now enable and start service.

During this you maybe some issue with service enable/start.

[root@a5f159e16af7 /]# systemctl enable jenkins
jenkins.service is not a native service, redirecting to /sbin/chkconfig.

[root@a5f159e16af7 /]# systemctl restart jenkins
Job for jenkins.service failed because the control process exited with error code. See "systemctl status jenkins.service" and "journalctl -xe" for details.

[root@a5f159e16af7 /]# /etc/init.d/jenkins start
/etc/init.d/jenkins: line 59: /etc/init.d/functions: No such file or directory

To resolve this issue install "initscripts".

[root@a5f159e16af7 yum.repos.d]# yum install -y initscripts
[root@3b5e4744c969 /]# systemctl start jenkins
[root@3b5e4744c969 /]# systemctl enable jenkins
jenkins.service is not a native service, redirecting to /sbin/chkconfig.
Executing /sbin/chkconfig jenkins on
[root@3b5e4744c969 /]# /sbin/chkconfig jenkins on

Now access Jenkins on default port 8080.

First time you need to set admin password. For that you run below command to see encrypted passowrd.

[root@feenixdv conf]# docker exec -it a5f159e16af7 cat /var/lib/jenkins/secrets/initialAdminPassword

Past output on login windows and set new password for admin. at the end you have login screen.