

Prometheus-Grafana-Node_Exporter
To start with on Infra monitoring front – we are going to have below tools
How these tools are collaborated to each other.

Here I am going to setup infra using Docker.
Download Docker images for “Prometheus” and “grafana”
[root@feenixdv ~]# docker pull grafana/grafana
[root@feenixdv ~]# docker pull prom/prometheus
[root@feenixdv ~]# docker images
REPOSITORY                           TAG                 IMAGE ID            CREATED             SIZE
prom/prometheus                      latest              5517f7057e72        4 days ago          97.8MB
grafana/grafana                      latest              d0454da13c84        6 days ago          240MB
[root@feenixdv ~]# mkdir –p /opt/prometheus/
[root@feenixdv ~]# cat /opt/prometheus/prometheus.yml
# my global config
global:
  scrape_interval:     15s # Set the scrape interval to every 15 seconds. Default is every 1 minute.
  evaluation_interval: 15s # Evaluate rules every 15 seconds. The default is every 1 minute.
  # scrape_timeout is set to the global default (10s).
# Alertmanager configuration
alerting:
  alertmanagers:
  - static_configs:
    - targets:
      # - alertmanager:9093

# Load rules once and periodically evaluate them according to the global 'evaluation_interval'.
rule_files:
  # - "first_rules.yml"
  # - "second_rules.yml"
# A scrape configuration containing exactly one endpoint to scrape:
# Here it's Prometheus itself.
scrape_configs:
  # The job name is added as a label `job=<job_name>` to any timeseries scraped from this config.
  - job_name: 'prometheus'
    # metrics_path defaults to '/metrics'
    # scheme defaults to 'http'.
    static_configs:
    - targets: ['localhost:9090']
  - job_name: 'PromNet'
    static_configs:
      - targets: ['192.168.40.173:9100']
  - job_name: 'Docker'
    static_configs:
      - targets: ['192.168.40.174:9323']

Configure “Node Exporter”.
In my example “Node Exporter” configured on separate VM.
IP:- 192.168.40.173
Download “Node Exporter” and start it. By default its used “9100” port.
[root@localhost ~]# wget  https://github.com/prometheus/node_exporter/releases/download/v0.17.0/node_exporter-0.17.0.linux- amd64.tar.gz
[root@localhost ~]# tar zxvf node_exporter-0.17.0.linux-amd64.tar.gz
[root@localhost ~]# cd node_exporter-0.17.0.linux-amd64/
[root@localhost node_exporter-0.17.0.linux-amd64]# ./node_exporter &
[1] 3000
[root@localhost node_exporter-0.17.0.linux-amd64]# INFO[0000] Starting node_exporter (version=0.17.0, branch=HEAD, revision=f6f6194a436b9a63d0439abc585c76b19a206b21)  source="node_exporter.go:82"

INFO[0000] Build context (go=go1.11.2, user=root@322511e06ced, date=20181130-15:51:33)  source="node_exporter.go:83"

INFO[0000] Enabled collectors:                           source="node_exporter.go:90"

INFO[0000]  - arp                                        source="node_exporter.go:97"

INFO[0000]  - bcache                                     source="node_exporter.go:97"

INFO[0000]  - bonding                                    source="node_exporter.go:97"

INFO[0000]  - conntrack                                  source="node_exporter.go:97"

INFO[0000]  - cpu                                        source="node_exporter.go:97"

INFO[0000]  - diskstats                                  source="node_exporter.go:97"

INFO[0000]  - edac                                       source="node_exporter.go:97"

INFO[0000]  - entropy                                    source="node_exporter.go:97"

INFO[0000]  - filefd                                     source="node_exporter.go:97"

INFO[0000]  - filesystem                                 source="node_exporter.go:97"

INFO[0000]  - hwmon                                      source="node_exporter.go:97"

INFO[0000]  - infiniband                                 source="node_exporter.go:97"

INFO[0000]  - ipvs                                       source="node_exporter.go:97"

INFO[0000]  - loadavg                                    source="node_exporter.go:97"

INFO[0000]  - mdadm                                      source="node_exporter.go:97"

INFO[0000]  - meminfo                                    source="node_exporter.go:97"

INFO[0000]  - netclass                                   source="node_exporter.go:97"

INFO[0000]  - netdev                                     source="node_exporter.go:97"

INFO[0000]  - netstat                                    source="node_exporter.go:97"

INFO[0000]  - nfs                                        source="node_exporter.go:97"

INFO[0000]  - nfsd                                       source="node_exporter.go:97"

INFO[0000]  - sockstat                                   source="node_exporter.go:97"

INFO[0000]  - stat                                       source="node_exporter.go:97"

INFO[0000]  - textfile                                   source="node_exporter.go:97"

INFO[0000]  - time                                       source="node_exporter.go:97"

INFO[0000]  - timex                                      source="node_exporter.go:97"

INFO[0000]  - uname                                      source="node_exporter.go:97"

INFO[0000]  - vmstat                                     source="node_exporter.go:97"

INFO[0000]  - xfs                                        source="node_exporter.go:97"

INFO[0000]  - zfs                                        source="node_exporter.go:97"

INFO[0000] Listening on :9100                            source="node_exporter.go:111"
Check “Node Exporter” working on port “9100”.

Now start both container.
Prometheus:-
            IP:- 192.168.40.174
            PORT:- 9090
Grafana:-
            IP:- 192.168.40.174
            PORT:- 3000
[root@feenixdv ~]# docker run -itd --name prometheus1 -v /opt/prometheus/prometheus.yml:/etc/prometheus/prometheus.yml -p 9090:9090  prom/Prometheus
[root@feenixdv ~]# docker run -itd --name grafana -p 3000:3000 grafana/grafana
Check container up or not.
[root@feenixdv ~]# docker ps –a
11e1168e0deb        grafana/grafana        "/run.sh"                3 hours ago         Up 3 hours                   0.0.0.0:3000->3000/tcp   grafana
e747177e9db4        prom/prometheus        "/bin/prometheus"        4 hours ago         Up 2 hours                   0.0.0.0:9090->9090/tcp   prometheus1
Now check “Prometheus” accessible on browser or not.
URL:- http://192.168.40.174:9090
Also check targets part. In the configuration we have same output which was configured inside” Prometheus.yml”

Now check “Grafana”
URL:- http://192.168.40.174:3000
Default login and password is “admin”.

First we need to configure data-sources.

Because our data source are Prometheus so select Prometheus as data source.

Fill details of Prometheus to connect and fetch data.

Once data source configured after that create graph. To create graph follow below screenshots.

Pick the query from Prometheus and put into Grafana
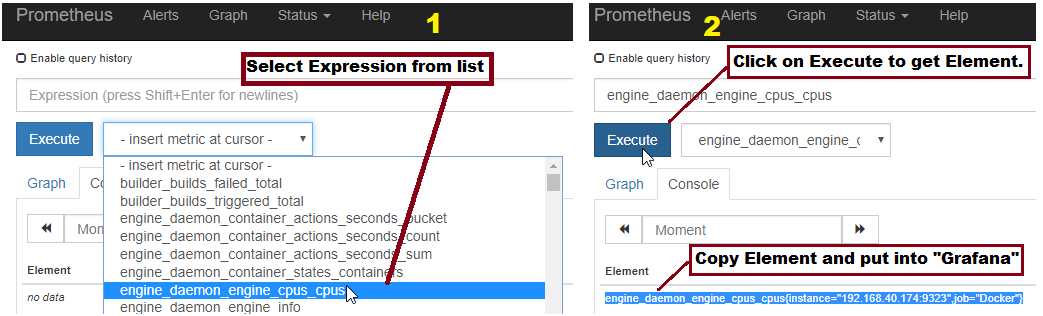
Add query string in Grafana.
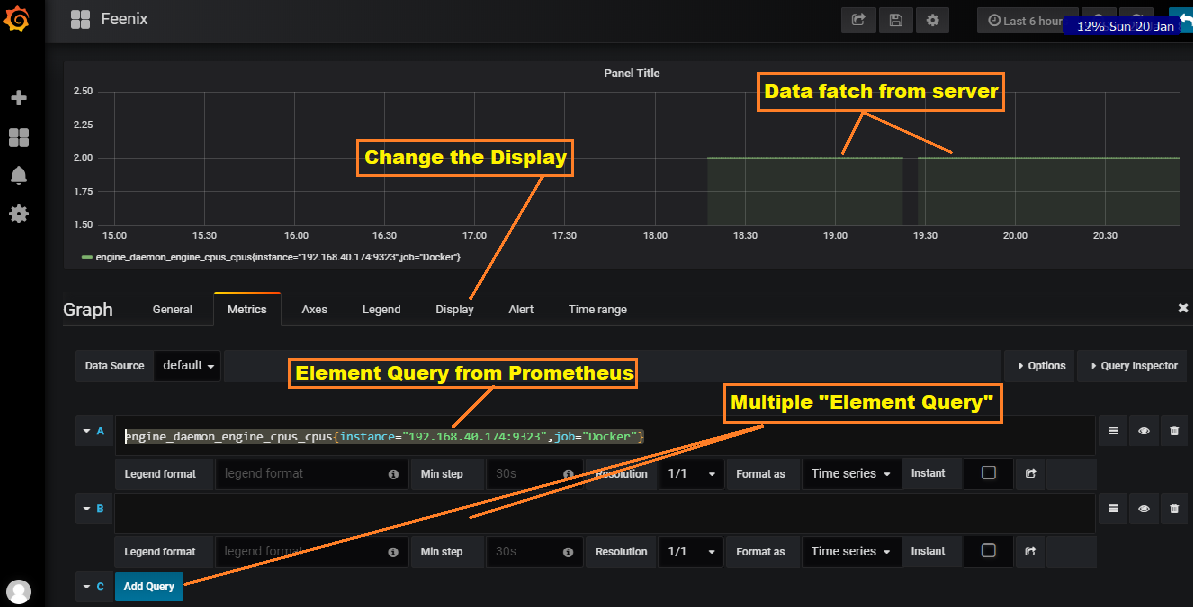
Dashboard look like this.

For Docker monitoring
for Docker monitoring we need to enable “metrices”. For enable create one file inside “/etc/docker”.
[root@feenixdv ~]# cat /etc/docker/daemon.json
{

                  "metrics-addr" : "192.168.40.174:9323",

                    "experimental" : true
}
Restart docker service and daemon.
[root@feenixdv ~]# systemctl daemon-reload
[root@feenixdv ~]# systemctl restart docker.service
Now Docker metrics are accessible on below URL.
http://192.168.40.174:9323/metrics

To monitor put required query string on “Grafana”.